
The following sections walk through the process of using FlyEye Silhouette to load microscopy data, segment images, and annotate the identified nuclei. They also demonstrate how FlyEye Silhouette Connect can be used to annotate nuclei using an iPad. Follow the menu options below to read ahead at your own pace.
Create a new project
You’ve dissected a fly eye and blasted it with lots of fancy lasers. Now you’re looking at a bunch of images like this: 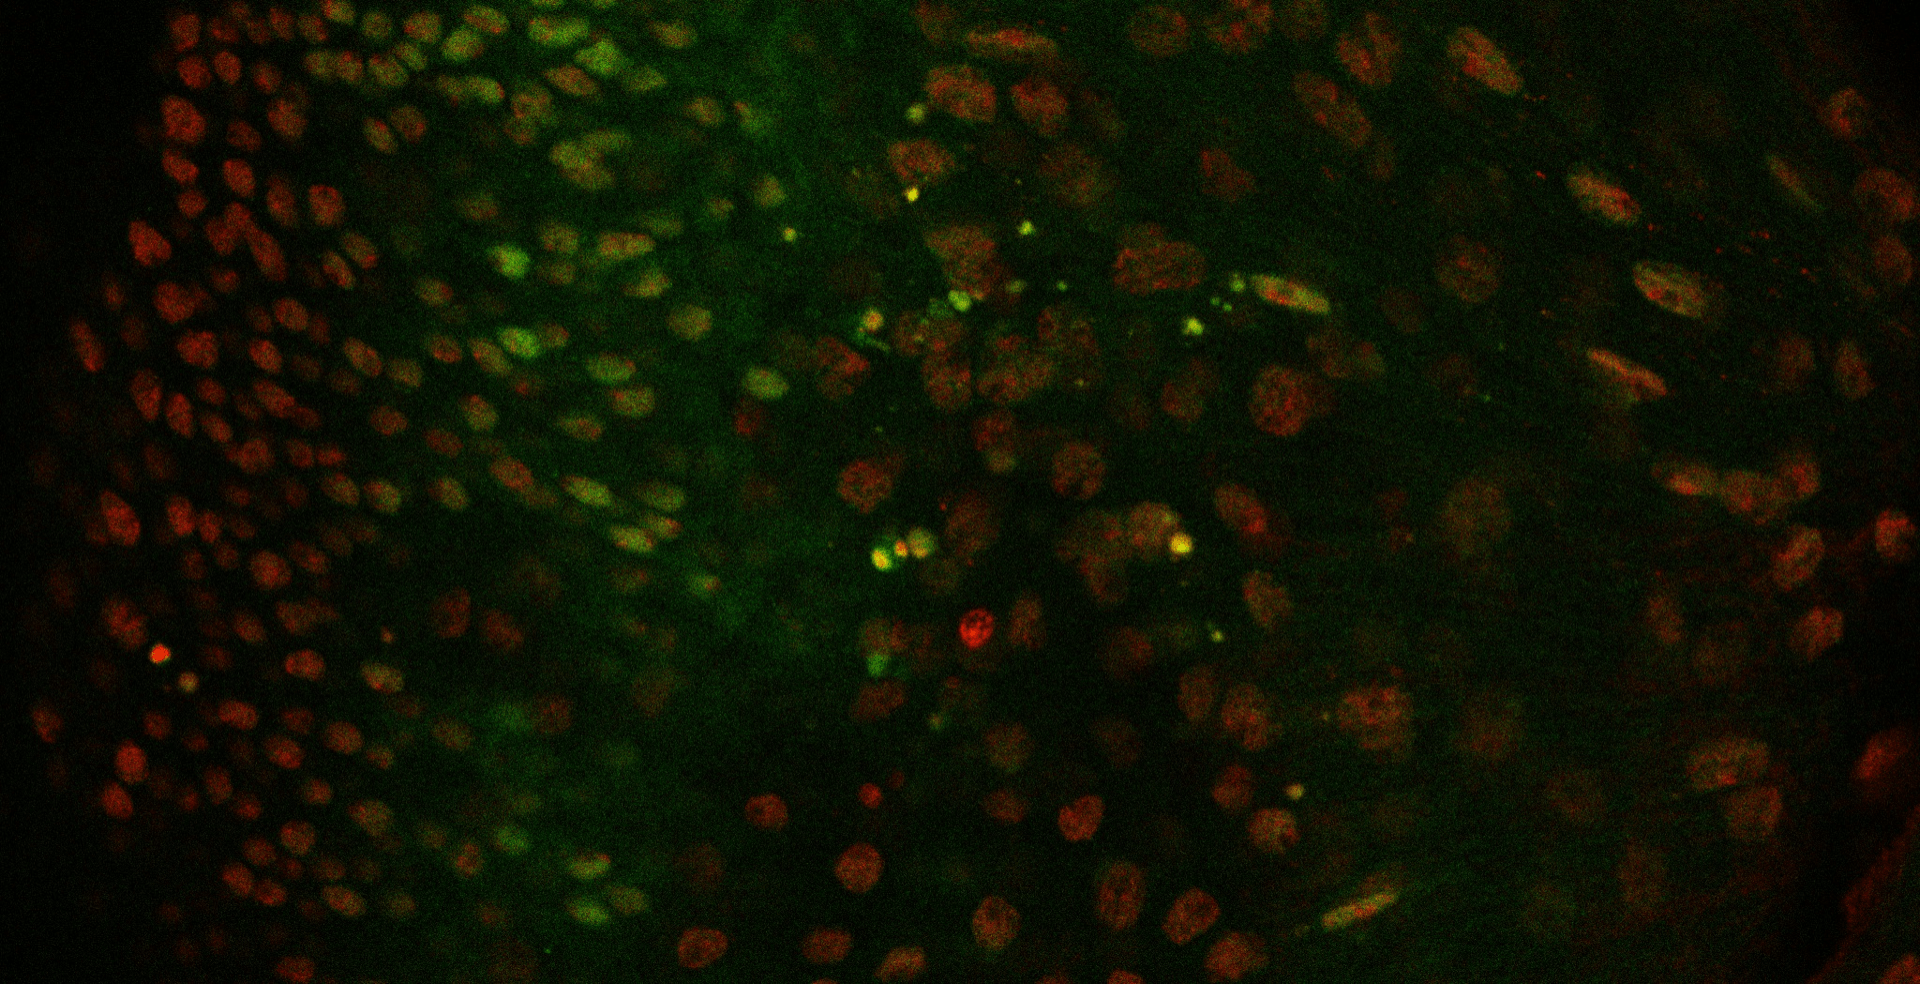 The Northwestern FlyEye Silhouette app will help you turn these images into numerical measurements. To get started, open the app then click on the button labeled “Create a new document.”
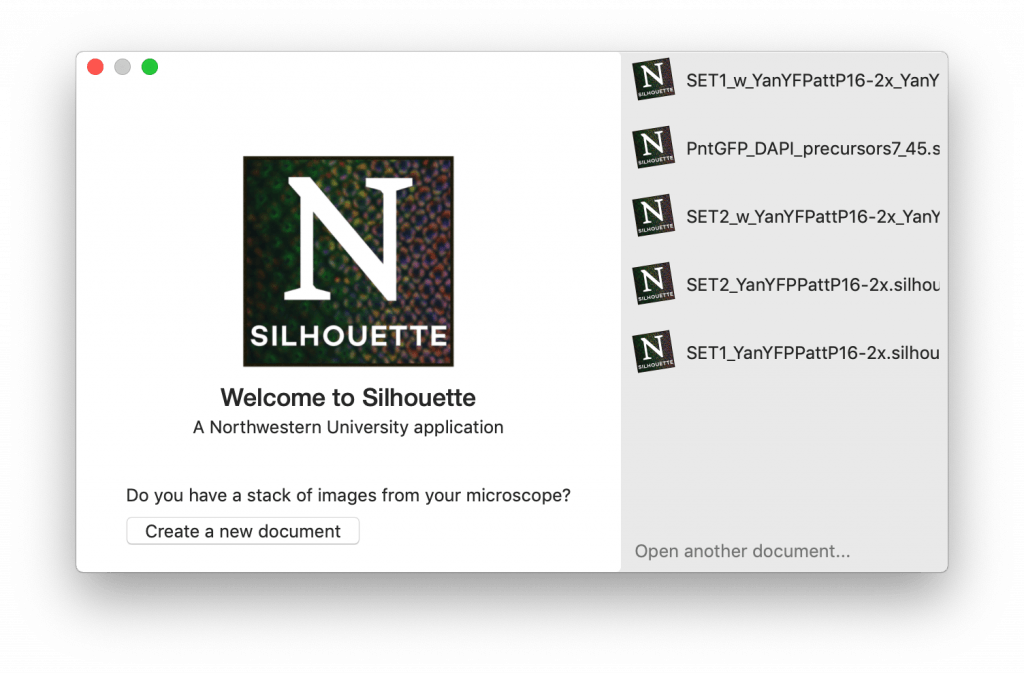
  You should now be looking at an empty window like the one below. This is the image browser. It’s a menu that lets you examine each image in your dataset. It’s currently blank because you haven’t added any images yet. To add an image, click the “+” button in the bottom left corner to open a file browser.
 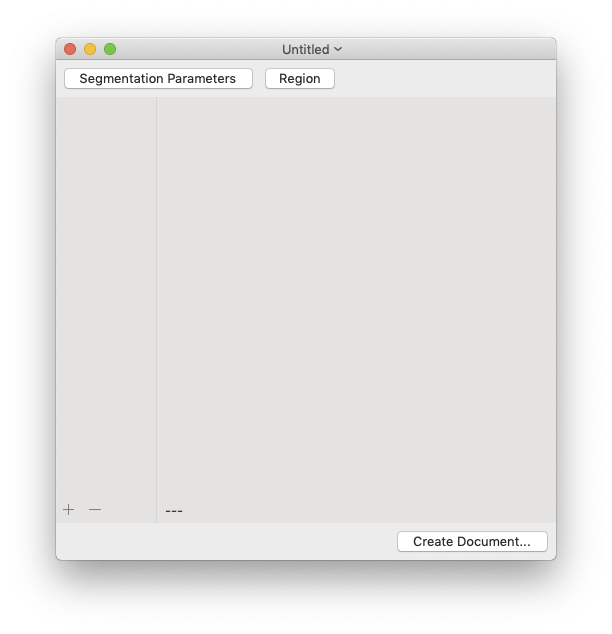 The filename of each image should appear when the image is added. You can also use the file browser to select and add multiple images at the same time. If the images in the image browser appear out of order, rearrange them using drag’n’drop. To remove an image, select its filename in the image browser and click the “-” button.
 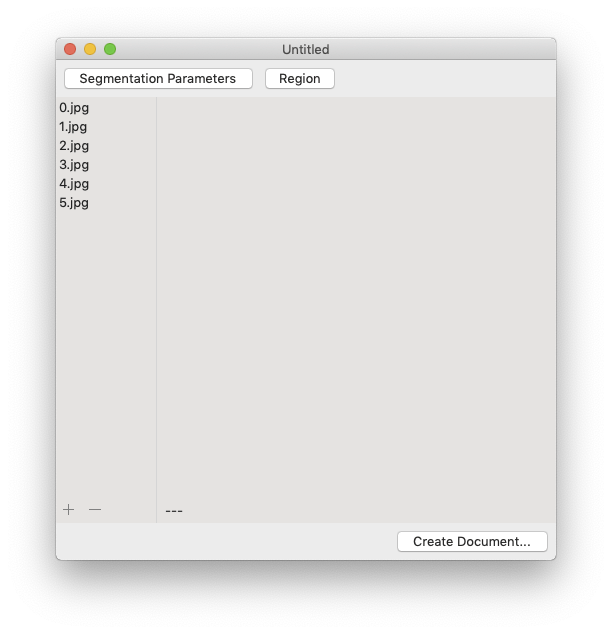 Clicking on a filename in the image browser will display the corresponding image:
 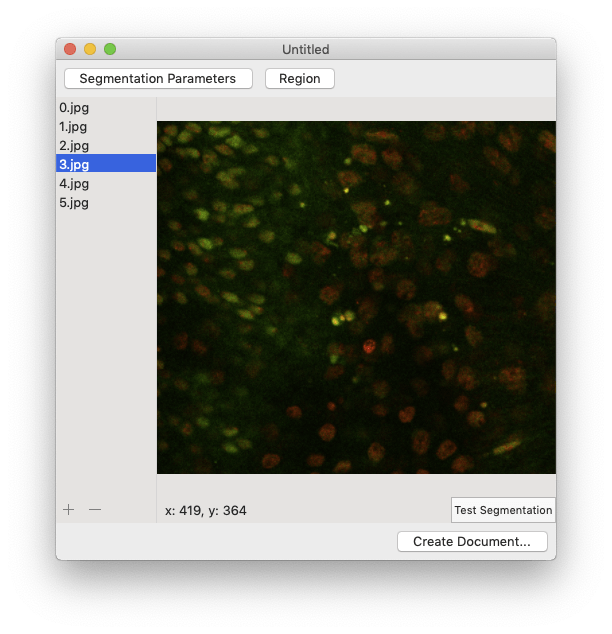 Now you’re ready to start turning your images into measurements!
Load an existing project
To open an existing document, open the FlyEye Silhouette app then click the “Open another document…” button. A file browser will open, allowing you to select an existing .silhouette file.
Silhouette files are complex, and can take a little while to open. If the file type is recognized and running correctly, you should see something like this:
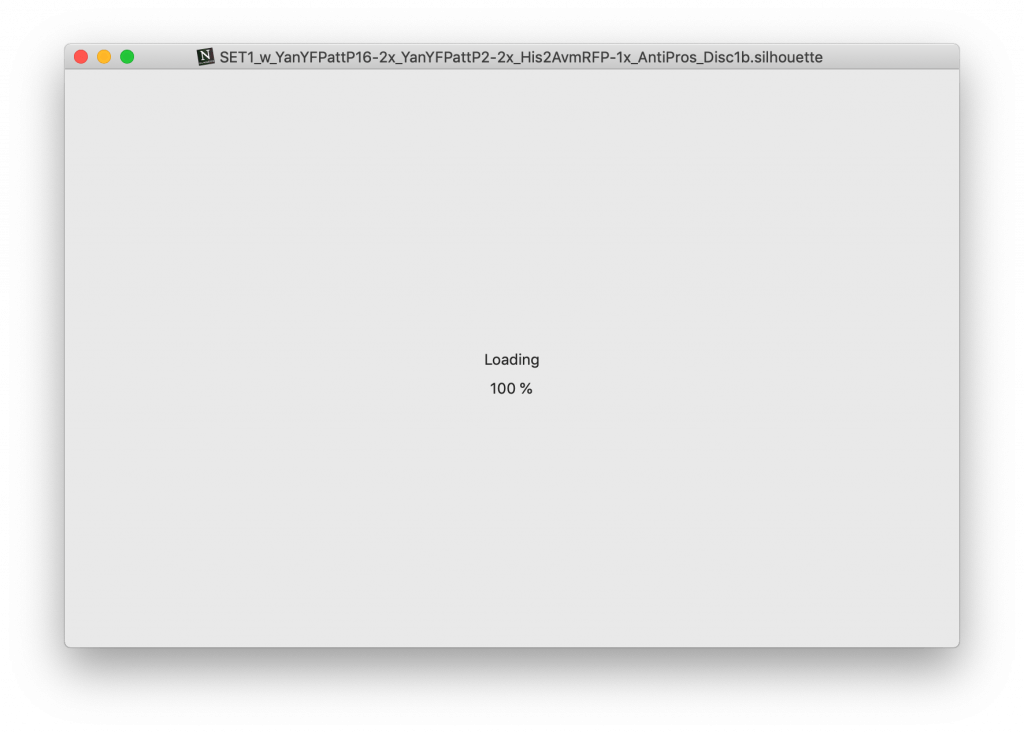
Once the document has loaded, a new screen should appear. From here, you’ll be able to continue working on your project at the same point you left off last time.
Segment images
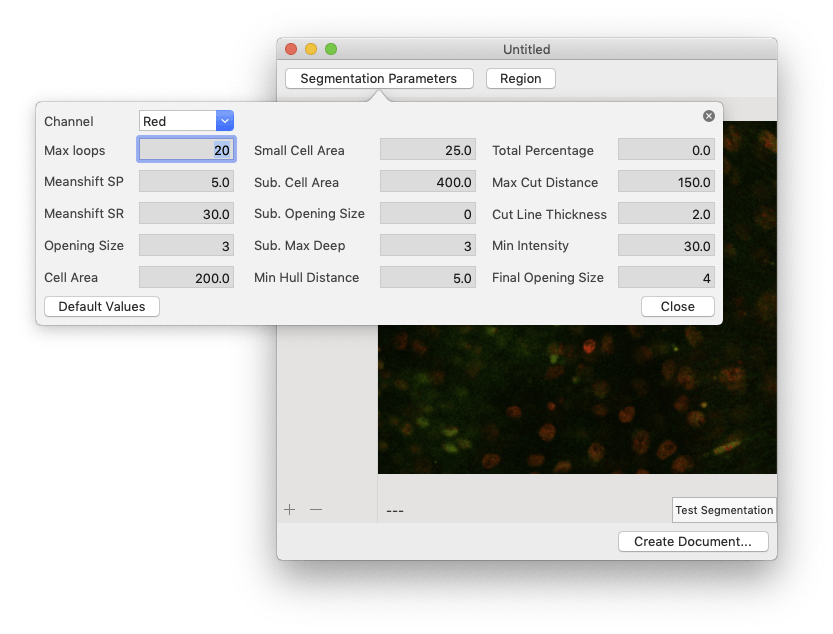
Silhouette generates measurements by averaging the intensities of all the pixels within each nucleus. The first step is to find all of the nuclei in each image. This process is called segmentation, and it relies upon several user-defined parameters. You can adjust these parameters to better suit your microscopy data by clicking the “Segmentation Parameters” button.
| Parameter | Step | Description |
|---|---|---|
| Channel | Pre-processing | Fluorescence channel used to mark cell nuclei (basis for segmentation). |
| Meanshift SP | Pre-processing | Meanshift spatial radius (see Meanshift). |
| Meanshift SR | Pre-processing | Meanshift color radius (see Meanshift). |
| Opening Size | Pre-processing | Size of the morphological opening kernel. |
| Max Loops | Contour detection | Number of contour detection steps. |
| Cell Area | Contour detection | Estimated area of an individual nucleus. |
| Min Intensity | Contour detection | Minimum allowable nuclear fluorescence intensity. |
| Small Cell Area | Contour splitting | Minimum allowable nuclear area following a cut. |
| Sub. Opening Size | Contour splitting | Size of the morphological opening kernel used during the contour-splitting routine. |
| Sub. Max Deep | Contour splitting | Maximum recursion depth for contour-splitting. |
| Min Hull Distance | Contour splitting | Minimum allowable distance between the convex hull and the proposed cut vertices. |
| Total Percentage | Contour splitting | Estimated percentage used to calculate the minimum cell area. |
| Max Cut Distance | Contour splitting | Maximum allowable cut length. |
| Cut Line Thickness | Contour splitting | Thickness of boundary separating two contours following a cut. |
| Final Opening Size | Contour splitting | Size of the morphological opening kernel used after each cut is applied. |
See the How it Works section for a detailed description of the segmentation algorithm used by the app. You don’t need to understand every detail of the algorithm to use the app, but it might help you understand what’s happening under the hood when you adjust each of the segmentation parameter values. You can restore the default values by clicking the “Default Values” button.
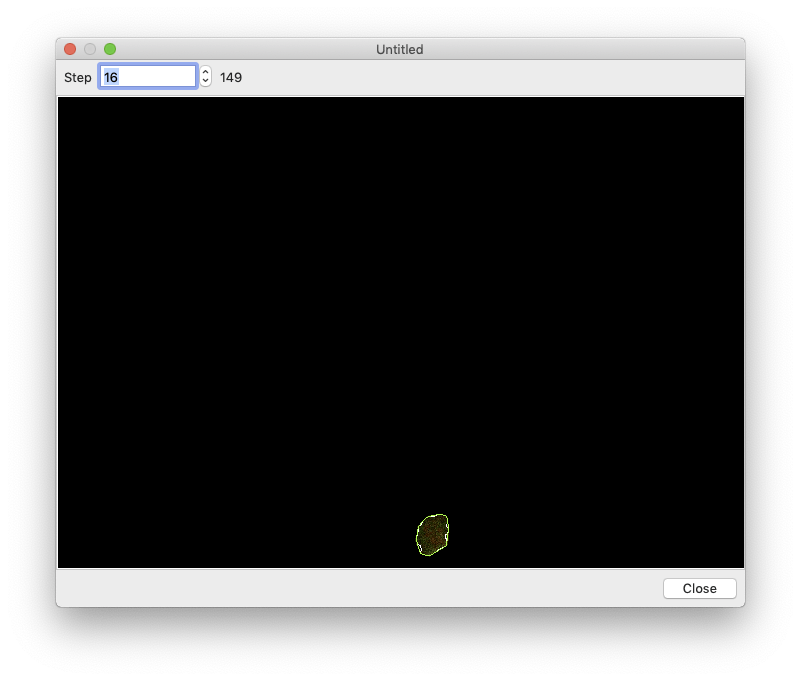
To crop your images, click the “Region” button then either enter the crop boundary in the provided menu or select the cropped region using the mouse. 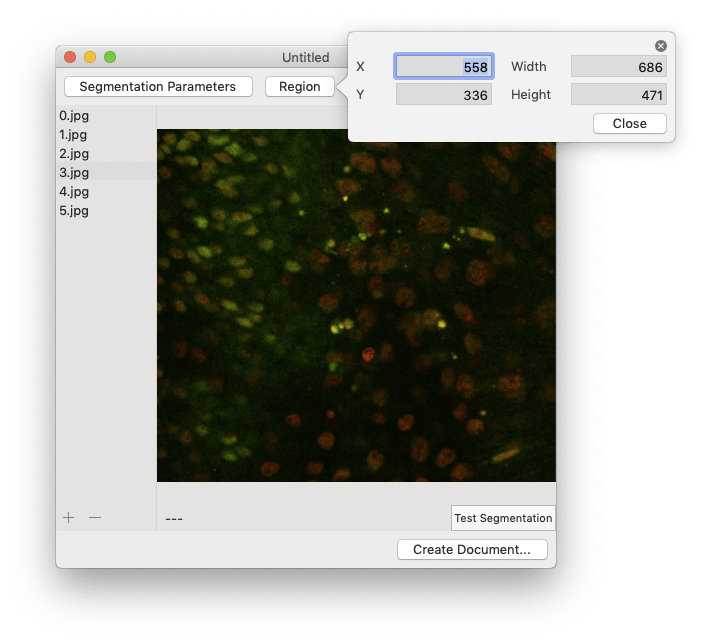 Segmentation can take a while, so you want to make sure everything is set up correctly before processing all of your images. To perform a test run, select an image in the image browser and click the “Test Segmentation” button. This should open a new window that allows you to navigate through each of the segmentation steps.
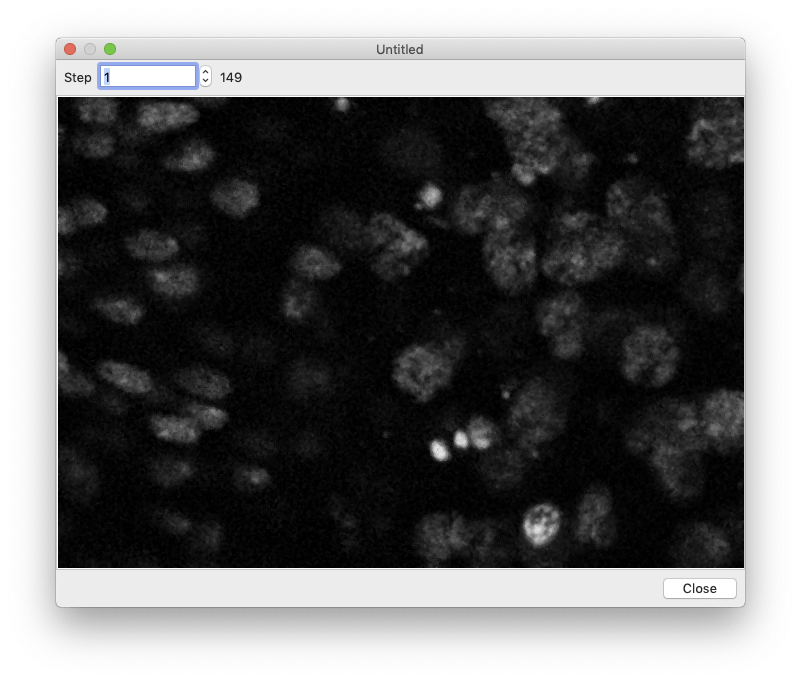
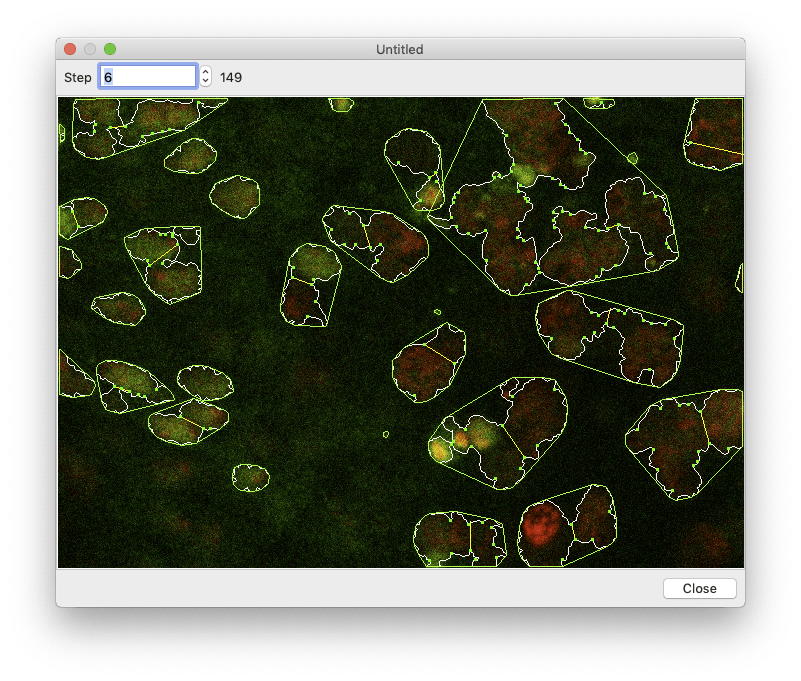
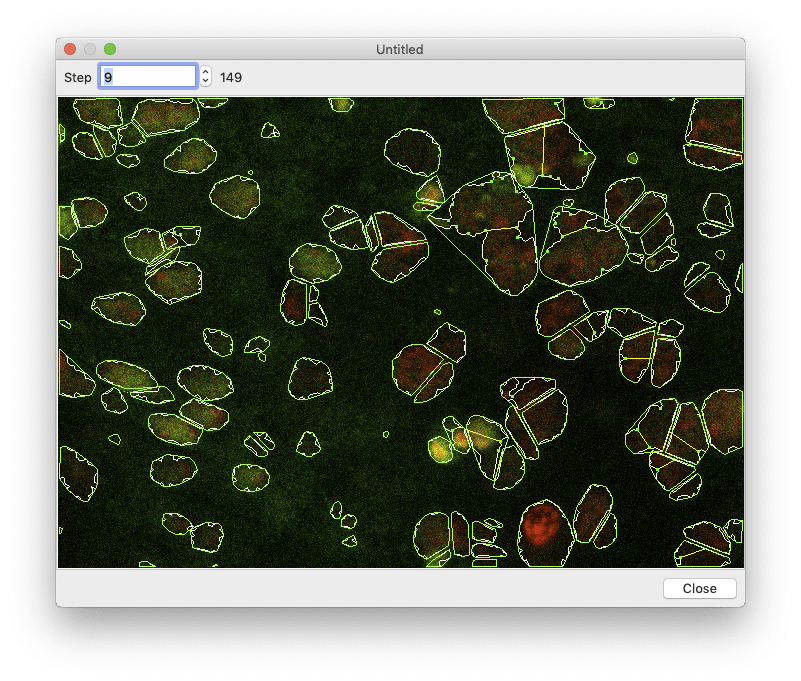
 |
 |
 |
 |
 |
If you’re satisfied with your choice of segmentation parameters and ready to segment all of the images, close the test window and click the “Create Document…” button.
The app will begin segmenting every image in the image browser. You can monitor its progress using the progress bar. If for any reason you want to cancel the segmentation, just click the grey exit button. When the segmentation finishes, the document will open automatically. 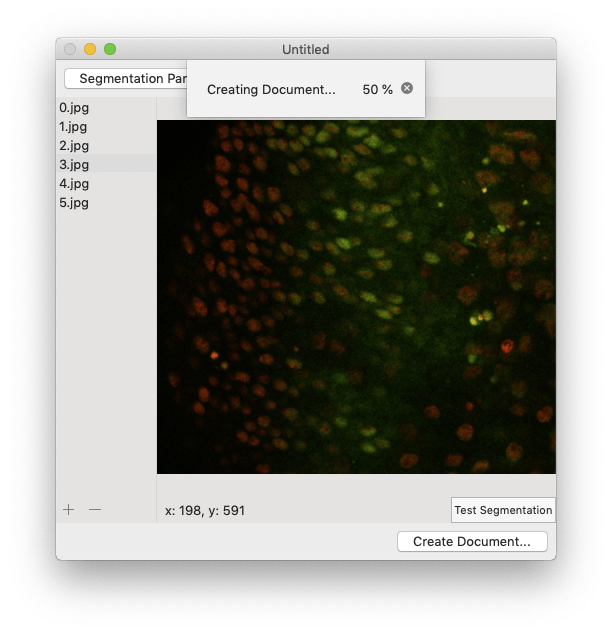
Annotate cells
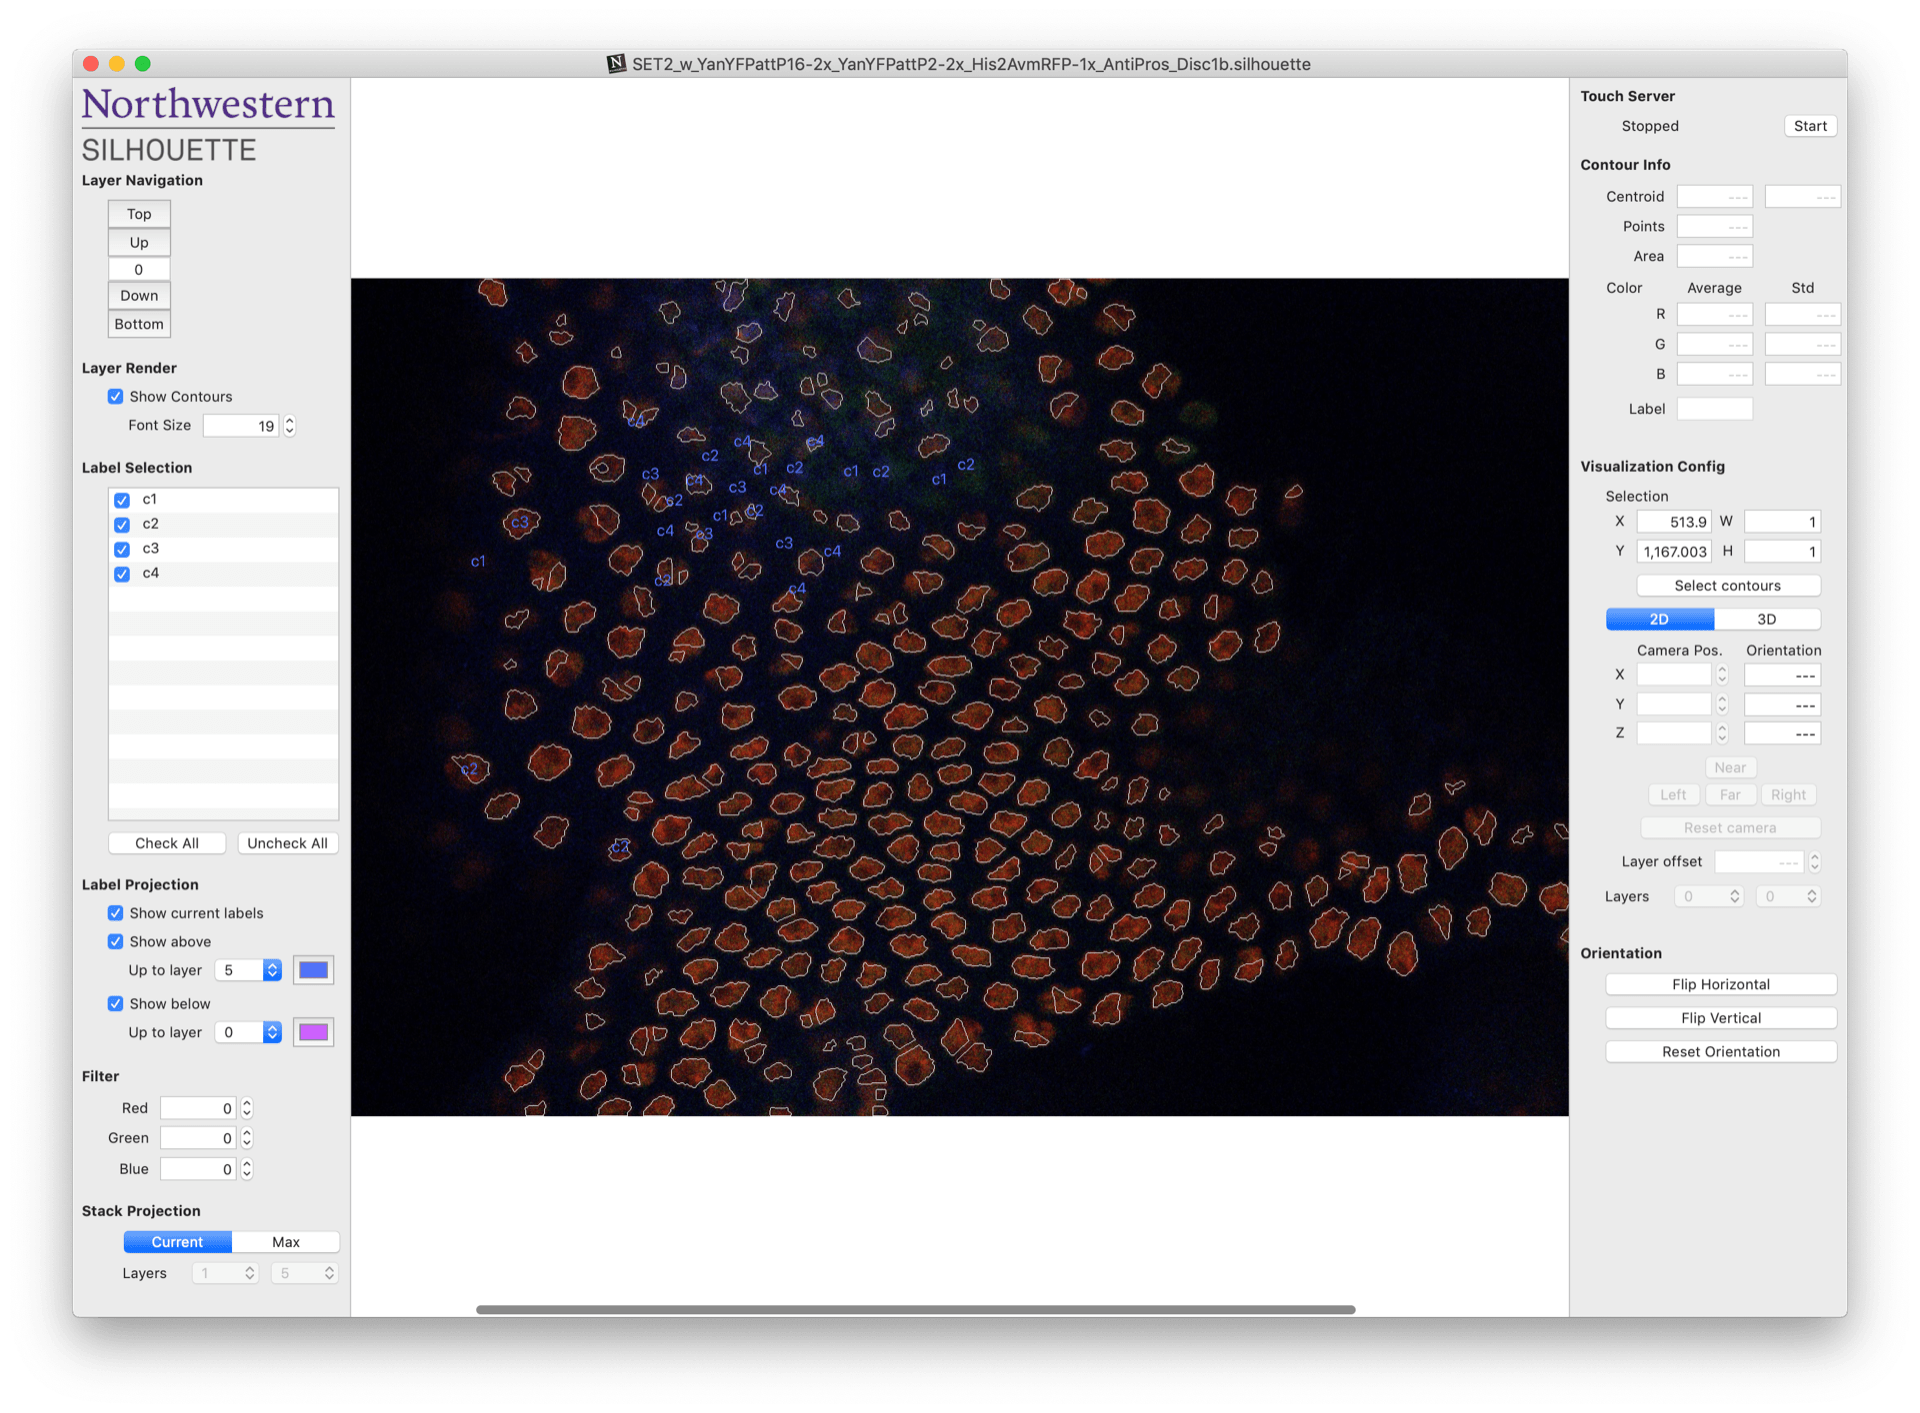
Once you’ve created a new project or opened an existing one, you should arrive at the document workspace shown below. One of your images should appear in the middle of the central workspace.

At this stage, segmentation is complete and Silhouette has drawn boundaries, or contours, around each of the objects that appear to be cell nuclei. The next step is to manually assign a label to each of these contours. This process is called annotation.
Annotation can become very tedious for large images with many nuclei. Fortunately, the left and right panels of the document workspace contain several tools designed to help make the task more manageable. An overview of these tools is provided below. It’s worth spending a few minutes to read over them – they will make your life much easier!
Left column:
- Layer Navigation: These buttons let you quickly navigate up and down through the image stack.
- Layer Render: These options let you adjust the appearance of the current layer. You can show or hide the identified contours, as well as change the front size of any labels that appear beside them.
- Label Selection: These check boxes allow you to select which labels are displayed on the image.
- Label Projection: This tool lets you limit the displayed labels to a specified number of layers above or below the current image. You may assign separate colors to each.
- Filter: These filters allow you to modify the displayed intensity of each color channel in your image. For instance, maybe your Green reporter is all over the place and it’s easier to just ignore it. You can do that by adjusting the “Green” filter level. Note that these filters only affect how the image is displayed – they will not affect your measurements.
- Stack Projection: This tool will allow you to perform a maximum intensity projection across multiple consecutive layers. This could be helpful when you have a weak reporter signal that is hard to distinguish within a single layer.
Right column:
- Touch Server: You can also assign labels using an iPhone or iPad. Click the “Start” button to connect one of these devices using Silhouette Touch.
- Contour Info: Each contour in the image corresponds to an individual measurement. This panel displays all of the measured properties of the currently selected contour. These include the spatial position, number of pixels, average fluorescence intensity, and fluorescence standard deviation. This menu also displays any labels that were assigned to the contour, which you can also modify.
- Visualization Config: Sometimes it’s difficult to see the whole picture by studying individual images, so this tool lets you visualize several layers in three dimensions. To toggle the 3D viewer, either use the cursor to select a region of the image or specify a boundary using the provided fields. Then, click the “3D” tab to activate the 3D viewing environment. While in the environment you can modify the position and orientation of the camera and select which layers you want to display.
- Orientation: This tool lets you flip the stack horizontally and vertically.
To annotate a contour, select it by clicking on or within the displayed boundary. The selected contour should now be surrounded by a white bounding box. Next, type the desired label into the Label field that appears under the Contour Info section of the right tool panel. That’s it! Your annotation is automatically saved within the corresponding Silhouette file. You can also update or replace an existing annotation by selecting a contour and editing the previously assigned label.
Connect to Silhouette Connect
The app supports annotation using an iPad, as long as the document remains open on your Mac and both devices are connected to the same network.
First, you’ll need to download Northwestern FlyEye Silhouette from the App Store and install it on your device. Once opened, you should see a welcome page explaining how to connect your device with the mac application.
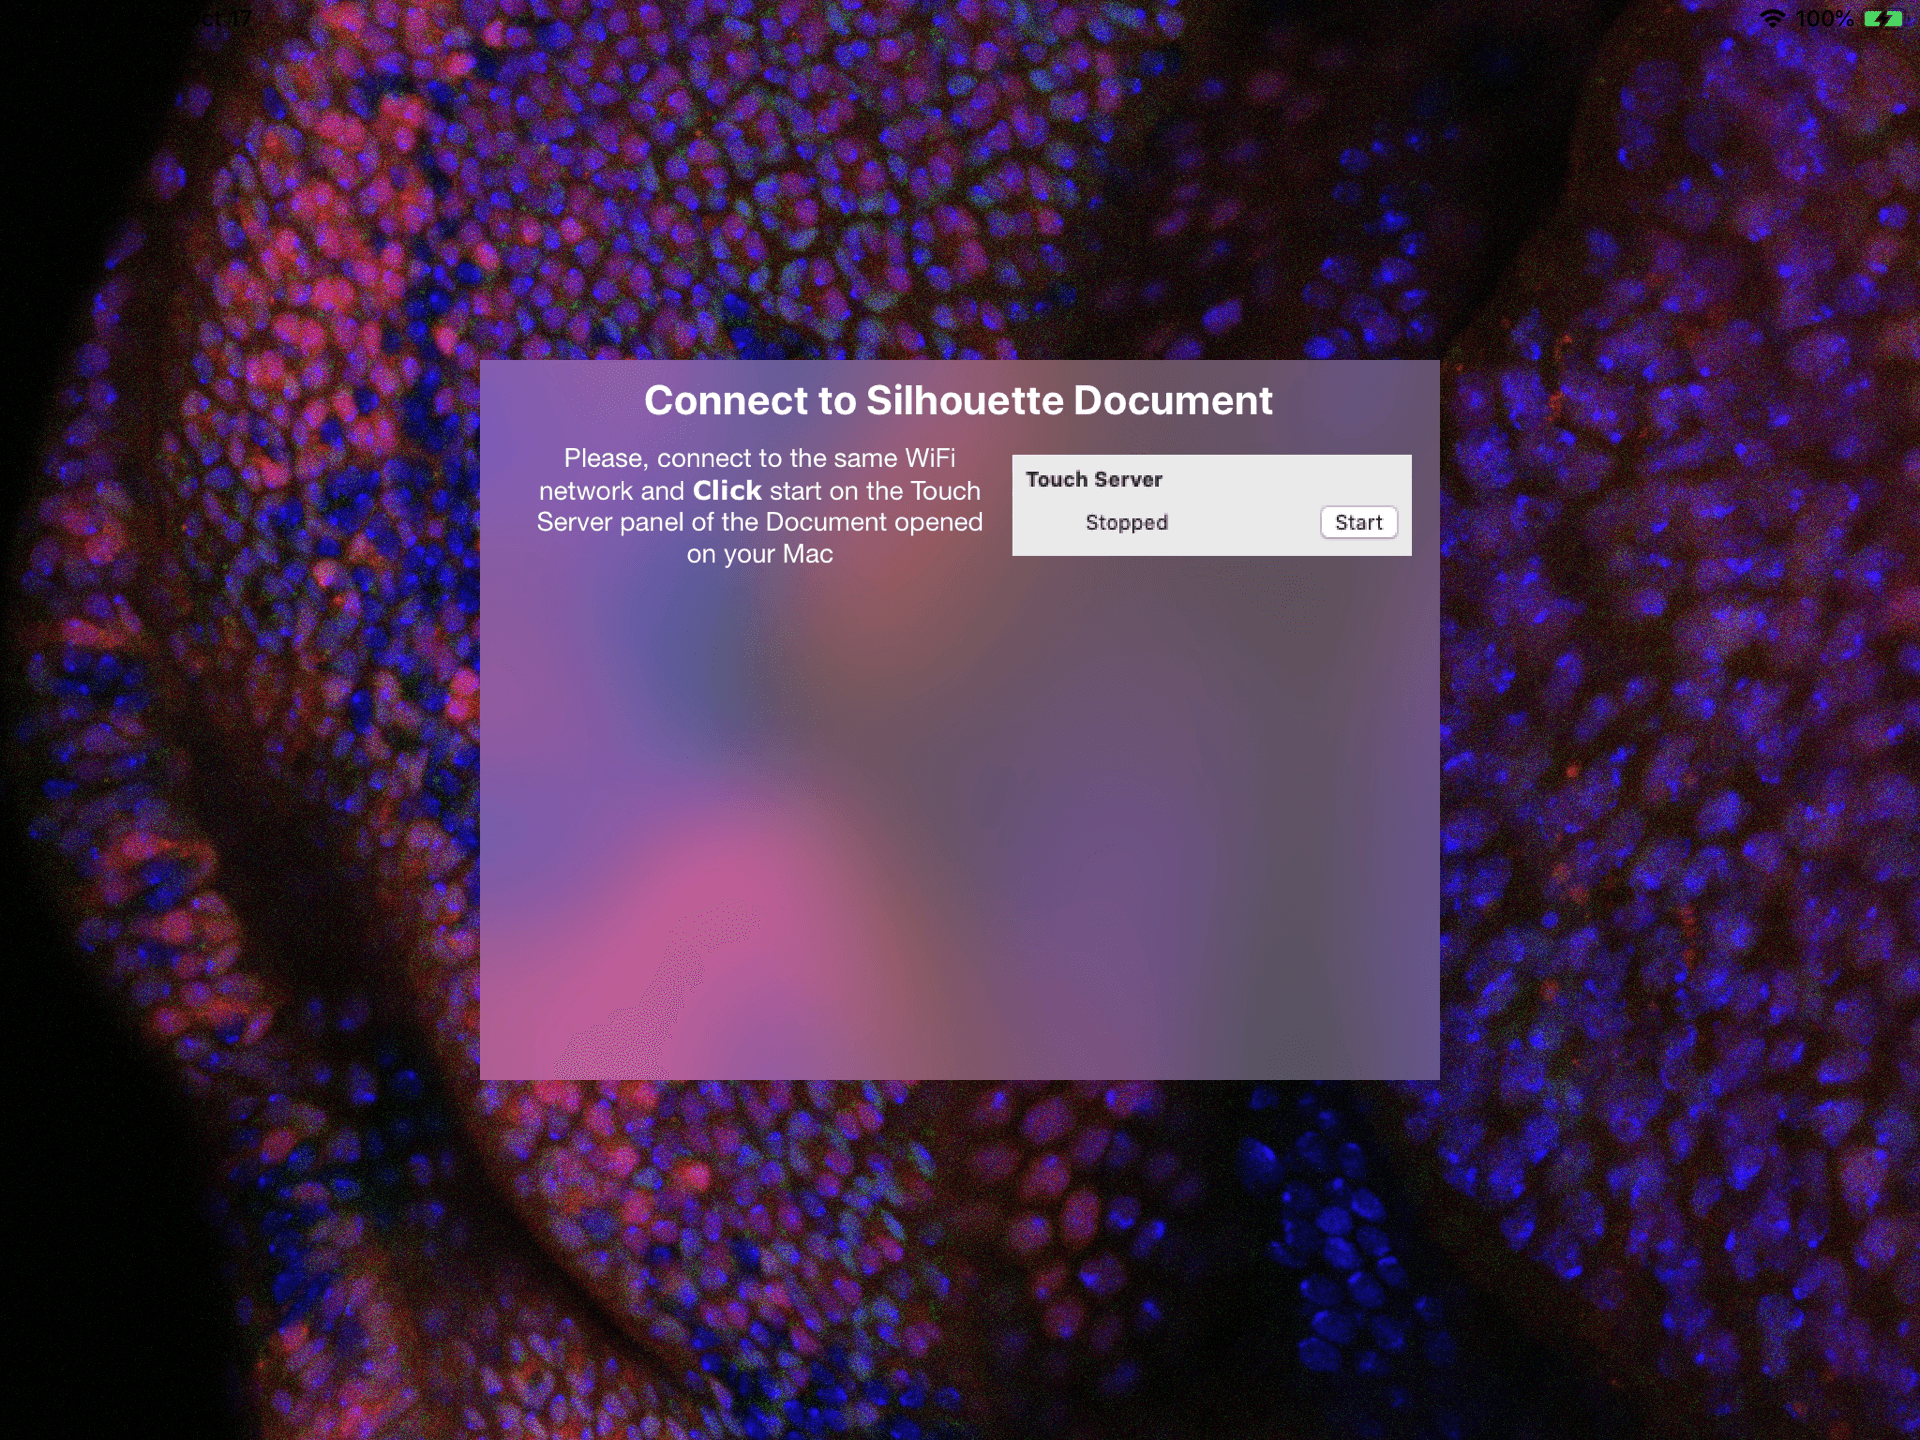
The devices are connected by starting a server from the mac app, then connecting to it with your external devices.
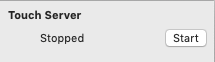
To start the server, click the “Start” button underneath the Touch Server header on the right side of the document workspace. The status indicator should change from “Stopped” to “Listening…”.
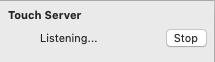
If your devices are connected to the same network, the iPad app will now list the document as “listening.””
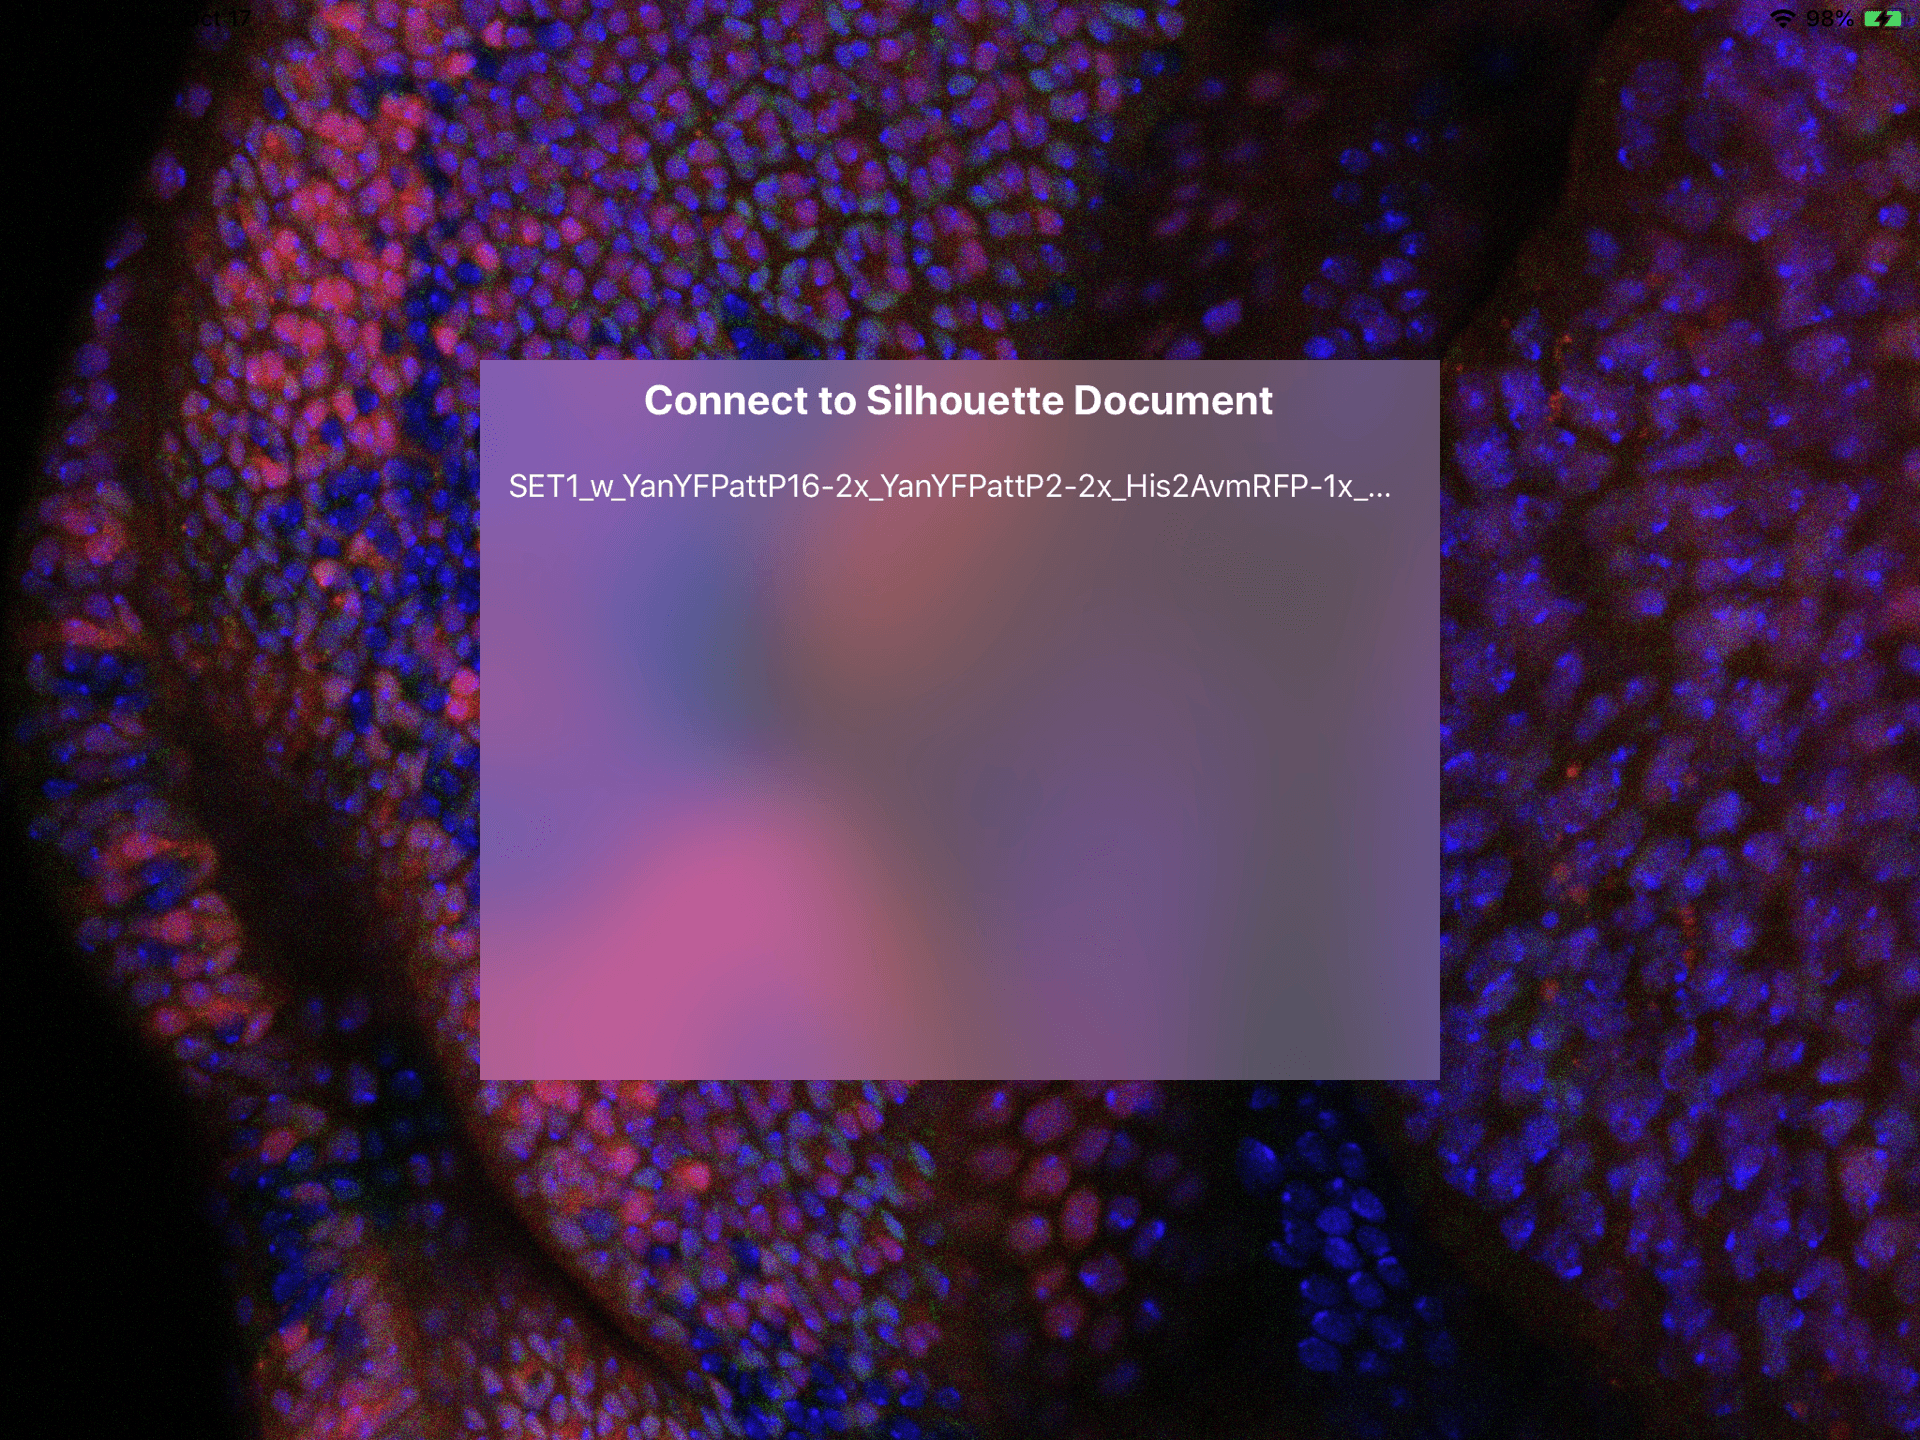
Tap the document on the iPad, then the mac app will ask for a 4 digit PIN:
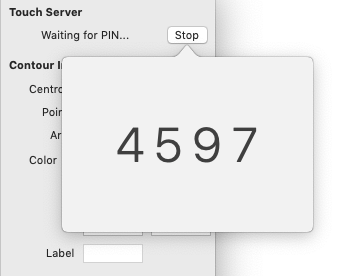
Enter the PIN on the iPad. The device is now connected.
You may now edit your annotations using both the mac App and your device.
Annotate with Silhouette Connect
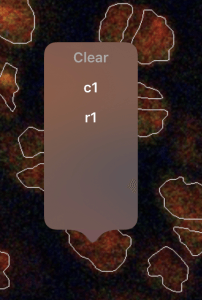
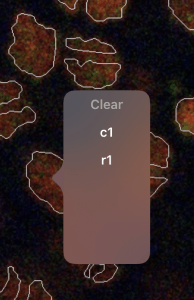
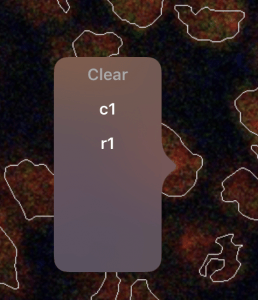
The Touch workspace will look similar to the central panel of the annotation workspace in the mac application. For example: 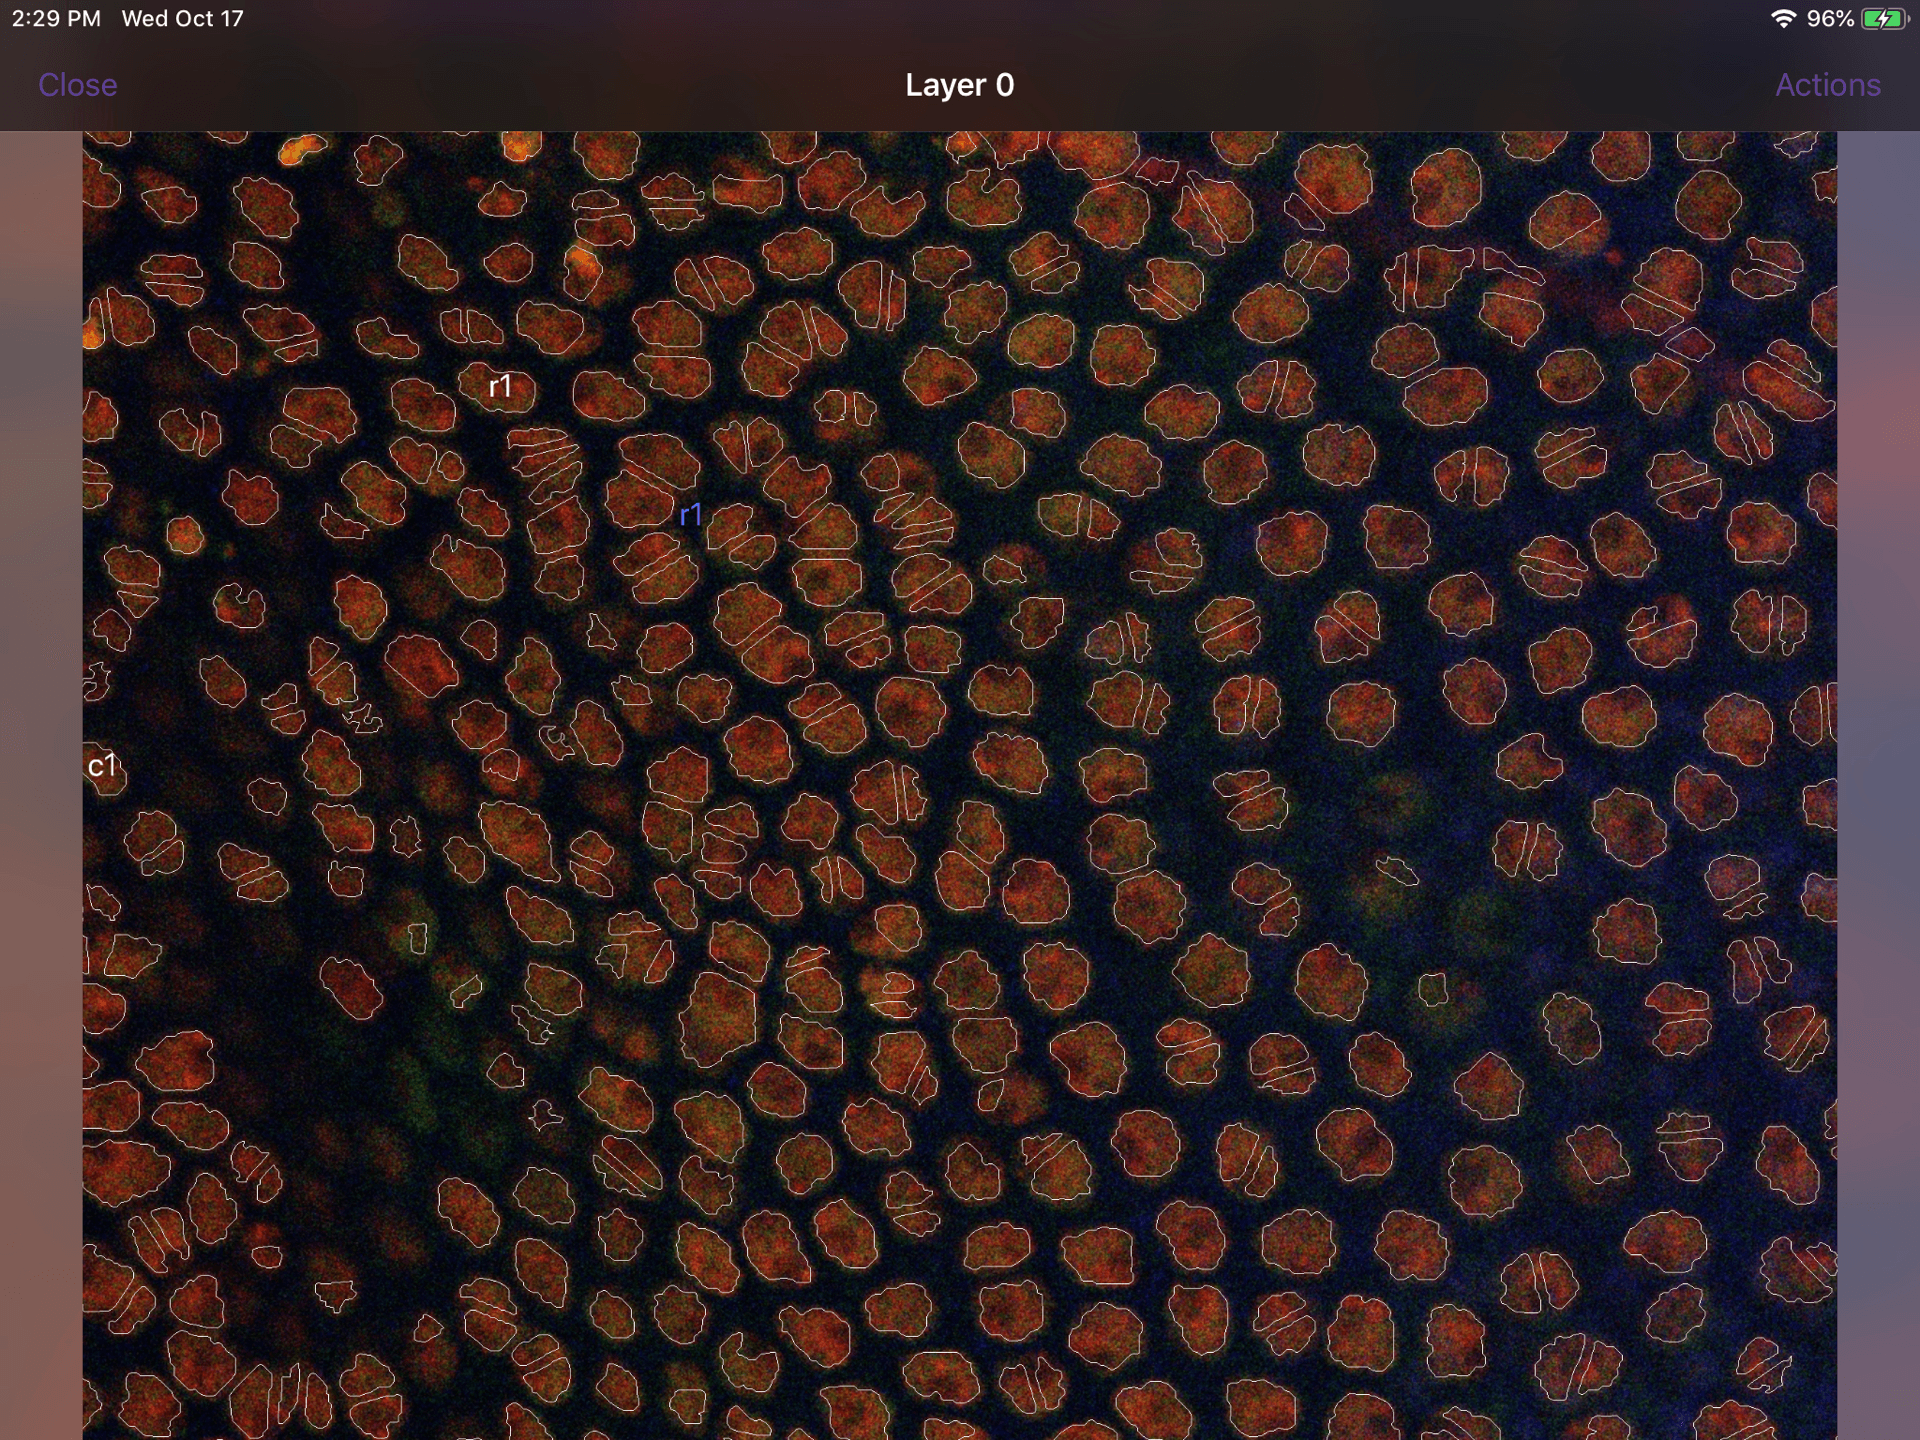 The iPad workspace also offers most of the same functionality as the mac application. You can move and zoom around the image using the pan and pinch gestures. If you tap on a contour, a small window will display all available labels that have already been assigned to at least one contour in the document (e.g. _c1_, _r1_ in the examples below). Tap on one of these labels to assign it to the contour. Finally, you can move up or down through the image stack by swiping up or down on the edge of the screen.
 |
 |
 |